
Most Indian investors spend 15–20 years saving every rupee — only to realize at the end that they picked the wrong fund.
In this 16-year study, the difference between the best and worst fund choice was over ₹28 lakh — on the exact same ₹9.25 lakh investment.
This article uses real NAV data from AMFI — October 2010 to February 2026 — to show you exactly how ETF vs Mutual Fund in India plays out over 16 years, across bull runs, market crashes, and everything in between. No theory. No guesswork. Just numbers.
Table of Contents
What Is the Real Difference Between ETF and Mutual Fund in India?
ETF — The Market Follower
ETF (Exchange Traded Fund) is a passive investment product. It simply replicates a market index — Nifty 50, Nifty Next 50, or Nifty SmallCap 250. There is no fund manager trying to outsmart the market. The expense ratio is extremely low — often 0.05% to 0.10%. You get exactly what the market delivers — nothing more, nothing less. One important point: you need a Demat account to invest in an ETF. Without it, ETF investing is not possible. To understand the basics of market investing, read our complete guide to mutual funds in India.
Active Mutual Fund — The Market Beater
An active mutual fund has a professional fund manager whose sole job is to beat the benchmark index. That is why the expense ratio is higher — 0.5% to 1.5%. When the fund manager succeeds, you get better returns than an ETF. When the manager fails — you pay more and earn less. The debate between ETF vs Mutual Fund in India largely comes down to this one question: can an active manager consistently beat the index?
Quick Comparison: ETF vs Active Mutual Fund
| Feature | ETF (Passive) | Active Mutual Fund |
| Management Style | Passive — tracks index | Active — fund manager decides |
| Expense Ratio | Very Low (0.05%–0.10%) | Higher (0.5%–1.5%) |
| Returns Potential | Market returns only | Can beat the market |
| Demat Account | Required | Not required |
| SIP Automation | Manual / complex | Easy — fully automated |
| Risk Level | Moderate (market risk) | Varies by category |
| Fund Manager Role | None | Critical — skill-based |
| Liquidity | Real-time trading | Redeemable at day-end NAV |
Both instruments have their place — but which one actually built more wealth over 16 real years? The data answers that.
The 16-Year SIP Study: Nifty ETF vs Large Cap vs Small Cap
Why This Data Is Different From Everything Else You’ve Read
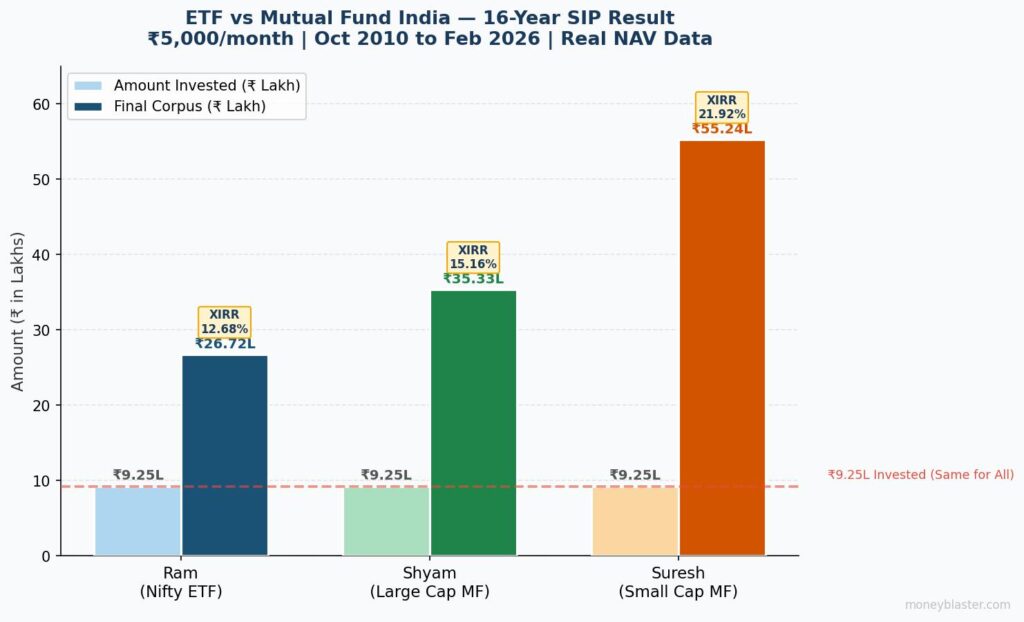
Every article on ETF vs Mutual Fund India talks theory. This one talks numbers. NAV data sourced directly from AMFI’s official website. All three funds belong to the same fund house — Nippon India — so there is no fund house bias. SIP started October 2010. Total amount invested: ₹9,25,000. Monthly SIP: ₹5,000. Duration: 15 years and 4 months. This is as real as it gets.
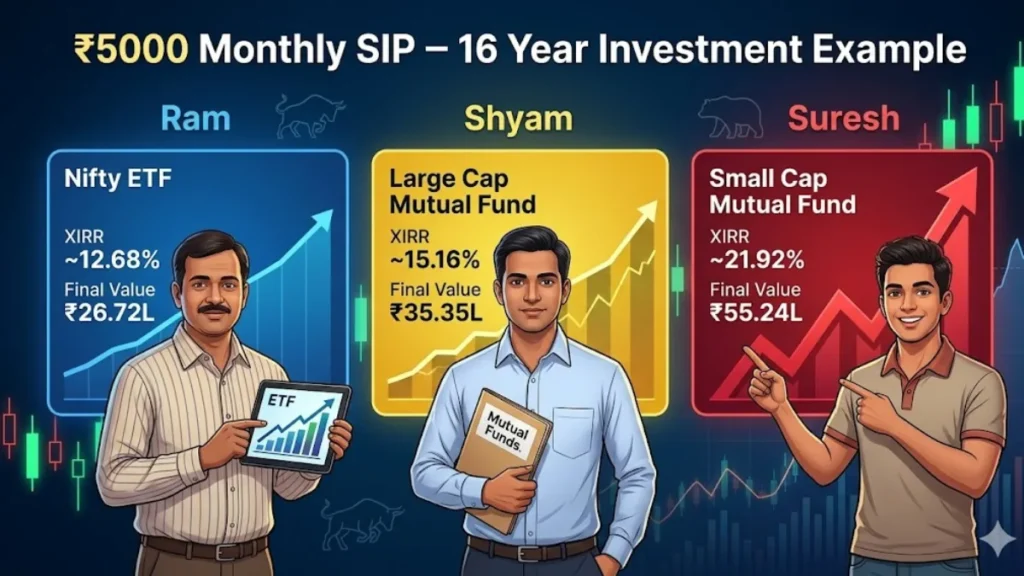
Meet Ram, Shyam, and Suresh
Ram invested ₹5,000/month in the Nippon Nifty BeES ETF — the Nifty 50 ETF.
Shyam invested ₹5,000/month in the Nippon Large Cap Fund — an actively managed large cap fund.
Suresh invested ₹5,000/month in the Nippon Small Cap Fund — one of India’s most popular small cap funds.
Same start date. Same monthly amount. Same fund house. Different categories. To understand what is SIP and how it works before diving into returns, that foundation matters.
How Each Fund Survived India’s Biggest Market Crashes
Before looking at returns, look at risk. Any fund can perform in a bull market. What separates the strong from the weak is how much it falls — and how fast it recovers.
2011 — Euro Crisis Bear Market (January to December 2011)
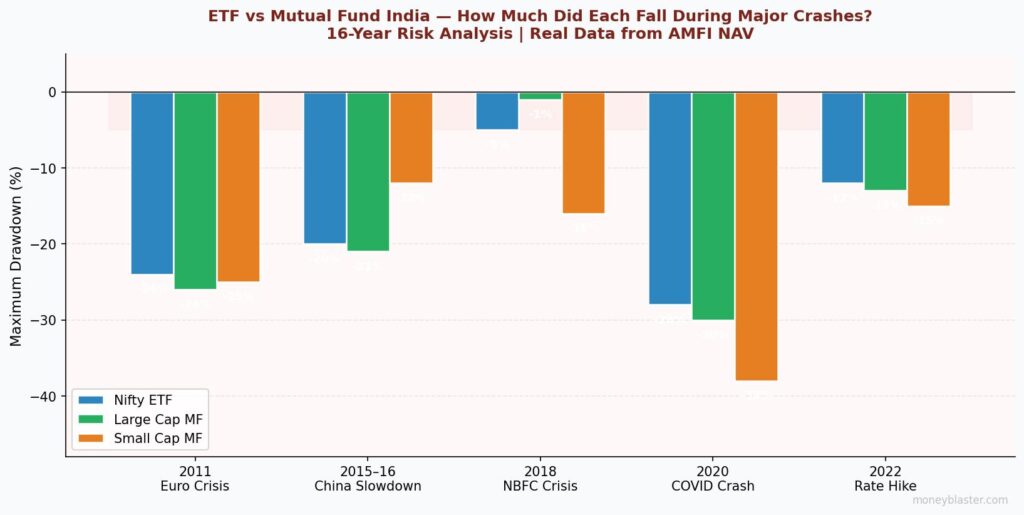
All three funds fell sharply. Nifty ETF: -24%. Large Cap: -26%. Small Cap: -25%. No hiding place in this crash. When global markets collapsed, all categories went down together.
2015–16 — China Slowdown (March 2015 to February 2016)
ETF fell -20%. Large Cap dropped -21%. Interestingly, Small Cap held up better here — because the weakness was concentrated in large-cap stocks. Small Cap actually recovered faster in the back half of this period.
2018 — NBFC Crisis (IL&FS, Yes Bank, DHFL)
This is where Small Cap took the worst hit: -16%. ETF dropped only -5%. Large Cap was nearly flat. The NBFC crisis was a liquidity crisis — and small companies bore the brunt. Fund selection mattered enormously here.
2020 — COVID Crash
All three crashed together in March 2020. But Small Cap recovered the fastest — bouncing back aggressively once the market reversed. This is the classic small cap pattern: it falls harder, and it climbs harder.
2022 — Interest Rate Hike
All three fell between -10% to -15%. Relatively balanced damage across categories. Rate hikes hurt the broader market equally.
Key insight: In every major crash, all three funds fell. ETF fell least. Small Cap fell most — but also recovered fastest. Risk and reward are two sides of the same coin.
Year-Wise Scoreboard: Who Won Each Year From 2010 to 2026?
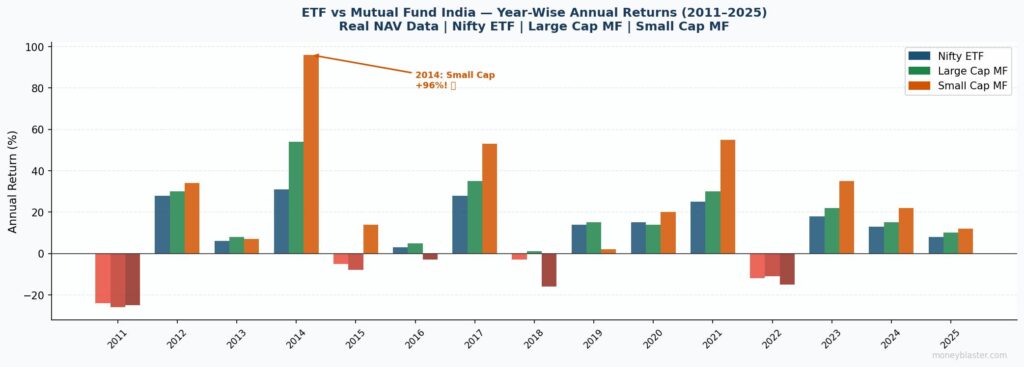
The year that changed Indian investor psychology forever was 2014. When the Modi government came to power, the stock market went into overdrive. Small Cap delivered 95–96% returns in a single year. Large Cap gave 54%. ETF gave 31%. After 2014, everyone wanted Small Cap — and flow into small cap funds skyrocketed. SEBI and AMFI had to step in and restrict lump sum inflows into certain small cap schemes — because if markets corrected, the damage to retail investors would have been catastrophic.
But 2014 is also a trap. Past returns do not guarantee future performance. In 2018–19, the same Small Cap fell -16% while ETF dropped just -5% and Large Cap stayed flat. The investors who chased 2014’s returns without understanding 2018’s risk paid the price.
16-Year Scorecard (2010–2026)
🏆 Small Cap won: 11 out of 16 years | Nifty ETF won: 4 out of 16 years | Large Cap won: 1 out of 16 years
₹9.25 Lakh Invested — The Final Numbers (October 2010 to February 2026)
| Investor | Fund | Total Invested | Final Value (Feb 2026) | XIRR |
|---|---|---|---|---|
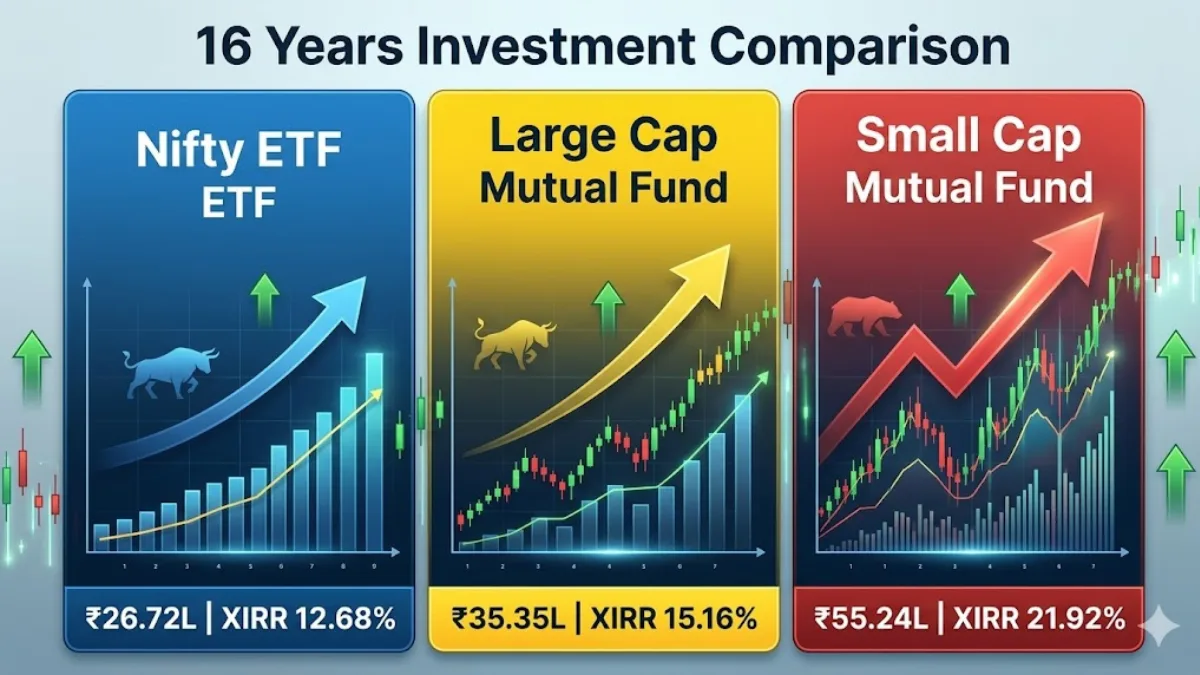
| Ram 👤 | Nippon Nifty ETF (Nifty BeES) | ₹9,25,000 | ₹26,72,000 | 12.68% |
| Shyam 👤 | Nippon Large Cap Fund | ₹9,25,000 | ₹35,33,000 | 15.16% |
| Suresh 👤 | Nippon Small Cap Fund | ₹9,25,000 | ₹55,24,000 | 21.92% |
These are not projections. These are actual returns calculated from historical NAV data. The difference between Ram’s ETF portfolio and Suresh’s Small Cap portfolio is ₹28.52 lakh — on the same ₹9.25 lakh investment.
What Is XIRR — And Why CAGR Doesn’t Work for SIP?
CAGR (Compound Annual Growth Rate) works when you invest one lump sum amount. XIRR is designed for SIP — where every monthly installment is invested at a different NAV, on a different date. XIRR accounts for the timing of each cash flow and gives you the true annualised return on your SIP. If someone tells you a SIP return in CAGR — ask again. For more on this, see our article on lump sum vs SIP — which is better for Indian investors.
ETF or Mutual Fund — Which One Is Right for You?
The data shows Small Cap wins on returns. But returns are only half the picture. The other half is: what is your financial goal, your timeline, and your risk tolerance? Financial planning works from your income and goals — not from what someone else with a gold watch is recommending on YouTube.
| Your Profile | Best Choice | Why |
|---|---|---|
| Low risk, capital protection | Nifty ETF | Low cost, market-linked, stable |
| Moderate risk, better returns | Large Cap Mutual Fund | Beats ETF over long term, no Demat needed |
| High risk, 15+ year horizon, wealth creation | Small Cap Mutual Fund | Maximum wealth creation — but max volatility too |
| Corpus already built (₹50L+) | ETF + Large Cap mix | Protect wealth, still grow |
No single fund is universally right. The right fund is the one that matches your goal — not your neighbour’s portfolio.
3 Costly Mistakes Indian Investors Make When Choosing Between ETF and Mutual Fund

Mistake 1: Following Influencers Blindly
Someone on YouTube says: “I only invest in ETF — it’s safe and smart.” Then 100,000 viewers follow the same advice — without knowing their own income, risk capacity, or goal. The influencer’s financial situation is not yours. Their portfolio should not be yours either. ETF vs Mutual Fund India is not a debate with a universal answer — it is a personal decision based on personal financials.
Mistake 2: Chasing Past Returns
Small Cap gave 95% in 2014. So investors poured money in — just in time for the 2018 NBFC crash that wiped out -16%. Past performance does not predict future returns. It never has. It never will. SEBI puts that disclaimer everywhere for a reason.
Mistake 3: Not Aligning Fund to Goal
Are you investing for wealth creation, capital protection, or both? ETF, Large Cap, and Small Cap are tools — and every tool has a specific job. Using a Small Cap fund for a 3-year goal, or using ETF for aggressive wealth creation at age 25, are both wrong approaches. First, define the goal. Then pick the fund. Read more in our complete guide to mutual funds in India.
One More Thing Most Articles Skip: Tax on ETF vs Mutual Fund Returns
ETF and Equity Mutual Funds are taxed the same way under Indian tax law — but the rules changed after Budget 2024. Short-Term Capital Gains (STCG): 20% if you sell within 1 year. Long-Term Capital Gains (LTCG): 12.5% on gains above ₹1.25 lakh per year if held for more than 1 year. For a full breakdown of how your returns are actually taxed, see our detailed article on tax on mutual fund returns in India.
Can I do SIP in ETF in India?
Yes, you can do SIP in ETF in India — but it is more complex than a regular mutual fund SIP. You need a Demat account, and the automation is not as seamless. Some brokers offer ETF SIP options, but execution depends on real-time market prices, not end-of-day NAV like a mutual fund SIP. For beginners, a regular index fund SIP is easier.
Is ETF better than Mutual Fund for long term in India?
Based on 16-year real SIP data from October 2010 to February 2026, Large Cap Mutual Fund gave 15.16% XIRR and Small Cap Mutual Fund gave 21.92% XIRR — both higher than Nifty ETF’s 12.68% XIRR. ETF wins on cost and simplicity. Active mutual funds win on long-term wealth creation — if you pick the right category for your goal.
Which gave more return — ETF or Small Cap Mutual Fund in India over 16 years?
Small Cap Mutual Fund gave 21.92% XIRR versus ETF’s 12.68% XIRR on the same ₹5,000/month SIP over 16 years. Final corpus: Small Cap ₹55.24 lakh vs ETF ₹26.72 lakh — a difference of ₹28.52 lakh on the same ₹9.25 lakh investment. But Small Cap also had the highest drawdowns during crashes. Higher return always comes with higher risk.
Can I invest in ETF without a Demat account in India?
No. ETF trades on the stock exchange like a stock — a Demat account is mandatory. If you want to invest without a Demat account, choose Index Funds instead. They track the same Nifty 50 or other indices as ETFs, but are structured as mutual funds. No Demat needed, automated SIP available, and slightly higher expense ratio than ETF.
What is the difference between ETF and Index Fund in India?
Both track the same index — like Nifty 50. The key difference: ETF trades on exchange in real time like a stock. Index Fund is redeemed at end-of-day NAV like any mutual fund. Index Fund is easier for beginners — no Demat needed, automated SIP, simpler process. ETF has a slightly lower expense ratio but requires active management of orders.
What is XIRR and why is CAGR wrong for SIP returns?
CAGR works only for lump sum investments where money is invested once. XIRR is designed for SIP — where every monthly installment is invested at a different NAV on a different date. XIRR accounts for the exact timing of each cash flow and gives the true annualised return on your SIP. If someone quotes SIP returns in CAGR — that number is inaccurate.
Final Verdict: ETF vs Mutual Fund India — What the Data Says
The 16-year data is clear. Small Cap Mutual Fund built the most wealth — ₹55.24 lakh from ₹9.25 lakh. Large Cap beat ETF by ₹8.6 lakh. ETF came last on returns but lowest on cost and complexity.
But the real lesson is not “buy Small Cap.” The real lesson is: align your fund to your goal, your income, and your risk capacity. ETF, Large Cap, and Small Cap are not competitors — they are tools. The investor who uses them correctly wins. The investor who copies someone else’s portfolio without understanding it loses — sometimes 15 years of hard-earned savings.
Your 15 years of investing will not come back. Make the decision based on your financial situation — not based on who is wearing the gold watch on YouTube.
ETF vs Mutual Fund India is not a debate with one right answer. It is a decision that deserves honest analysis — not social media noise. Now you have the data. Use it wisely.
⚠️ Disclaimer
This article is for educational and informational purposes only. The fund names mentioned (Nippon Nifty BeES ETF, Nippon Large Cap Fund, Nippon Small Cap Fund) are used solely as examples based on publicly available historical NAV data sourced from AMFI. This is not investment advice. Past returns do not guarantee future performance. Please consult a SEBI-registered financial advisor before making any investment decisions. Mutual fund investments are subject to market risk. Read all scheme-related documents carefully.