

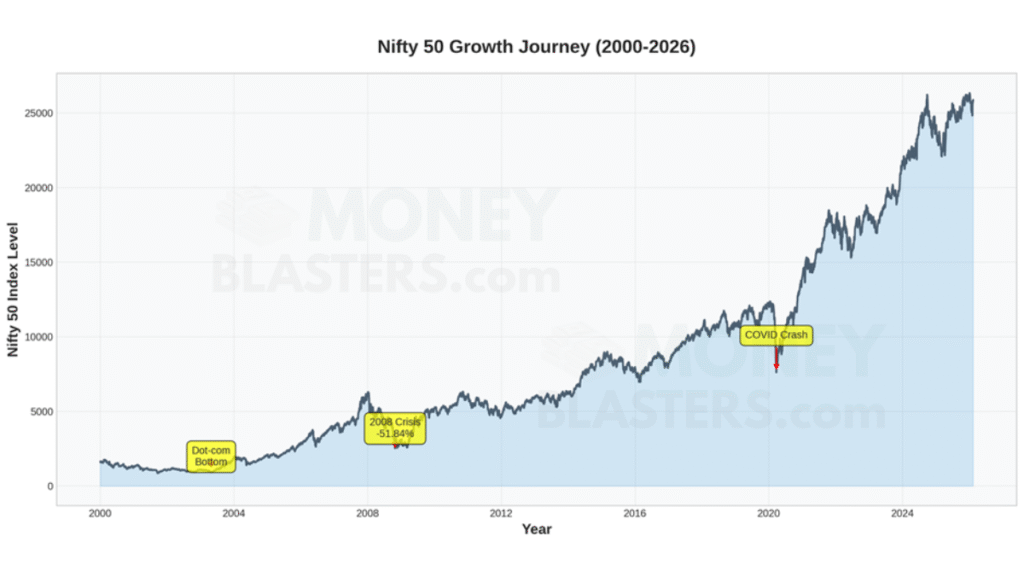
The Nifty 50 index has been the benchmark of India’s stock market performance for over two decades. Since January 3, 2000, when it opened at ₹1,592.20, the index has witnessed remarkable growth, weathered multiple crises, and delivered consistent long-term returns to investors. As of February 9, 2026, the Nifty 50 stands at ₹25,867.30, representing a stellar journey of wealth creation.
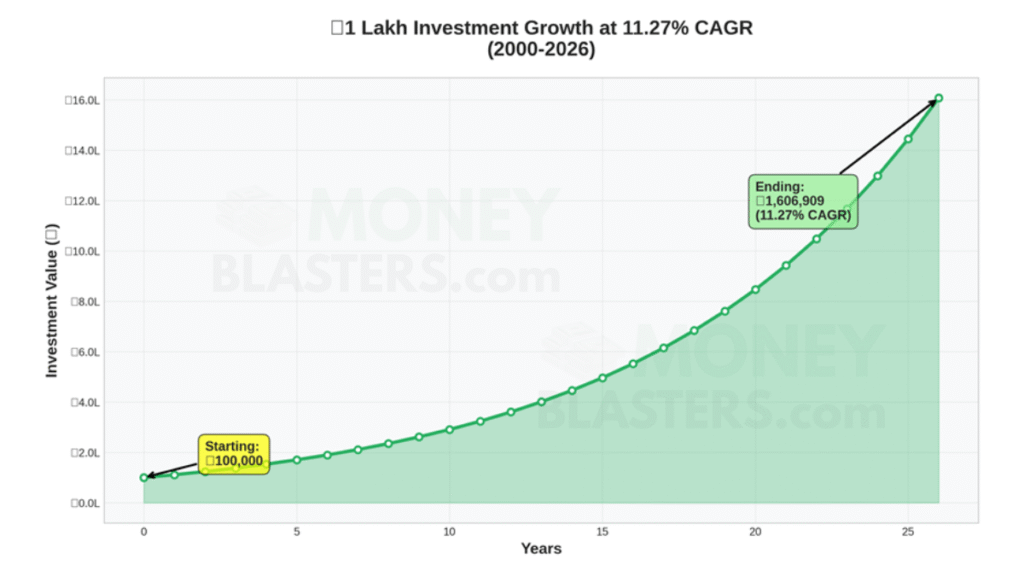
Over this 26-year period, the Nifty 50 has delivered a Compound Annual Growth Rate (CAGR) of 11.27% and an absolute return of 1524.63%. This means that ₹1 lakh invested in January 2000 would have grown to approximately ₹1624626 by February 2026. The journey, however, has been far from smooth, with the index experiencing both euphoric bull runs and devastating bear markets.
Nifty 50 Growth Journey (2000-2026)
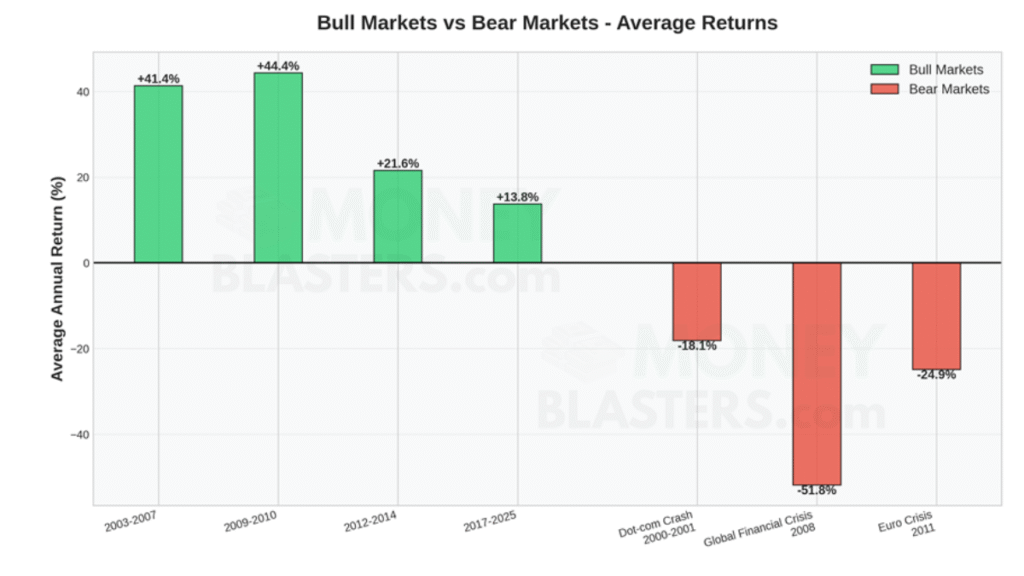
Major Bull Markets
The Nifty 50 has experienced several significant bull markets over the past 25 years. These periods of sustained growth have been driven by various factors including economic reforms, favorable global conditions, and strong corporate earnings.
| Period | Avg Annual Return | Key Drivers |
| 2003-2007 | +41.37% | Economic reforms, India Shining, Global growth |
| 2009-2010 | +44.36% | Post-GFC recovery, Fiscal stimulus |
| 2012-2014 | +21.57% | Modi election, Reform expectations |
| 2017-2025 | +13.88% | GST, Digitalization, Sustained growth |
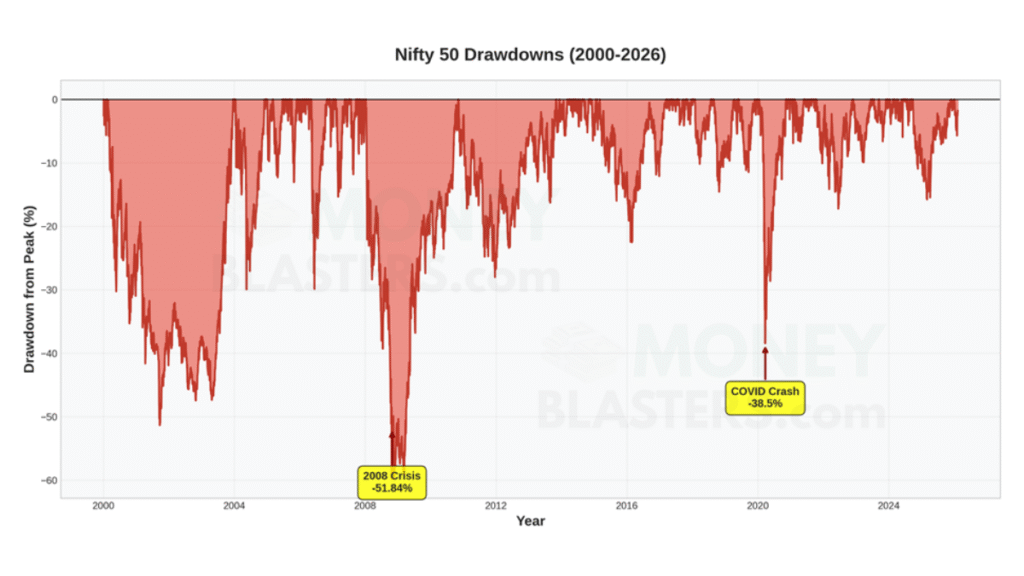
Major Bear Markets & Corrections
Despite the long-term upward trajectory, the Nifty 50 has faced several severe corrections. These bear markets tested investor patience but also created opportunities for long-term wealth creation.
| Bear Market | Period | Decline | Recovery Time |
| Dot-com Crash | 2000-2001 | -33.52% | ~2 years |
| Global Financial Crisis | 2008 | -51.84% | ~2 years |
| Euro Crisis | 2011 | -24.90% | ~1 year |
| COVID-19 Crash | Mar 2020 | -38.50% | ~6 months |
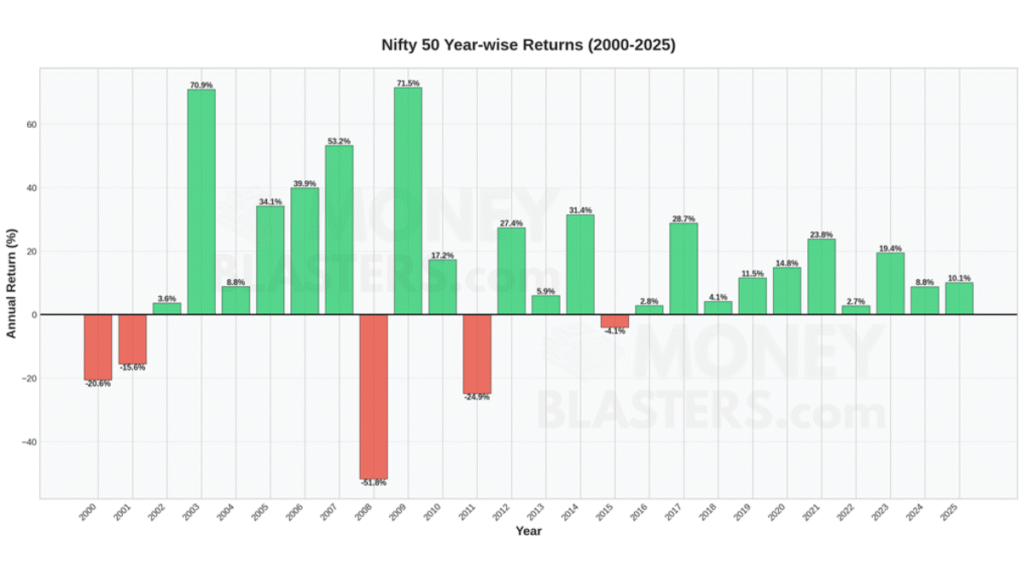
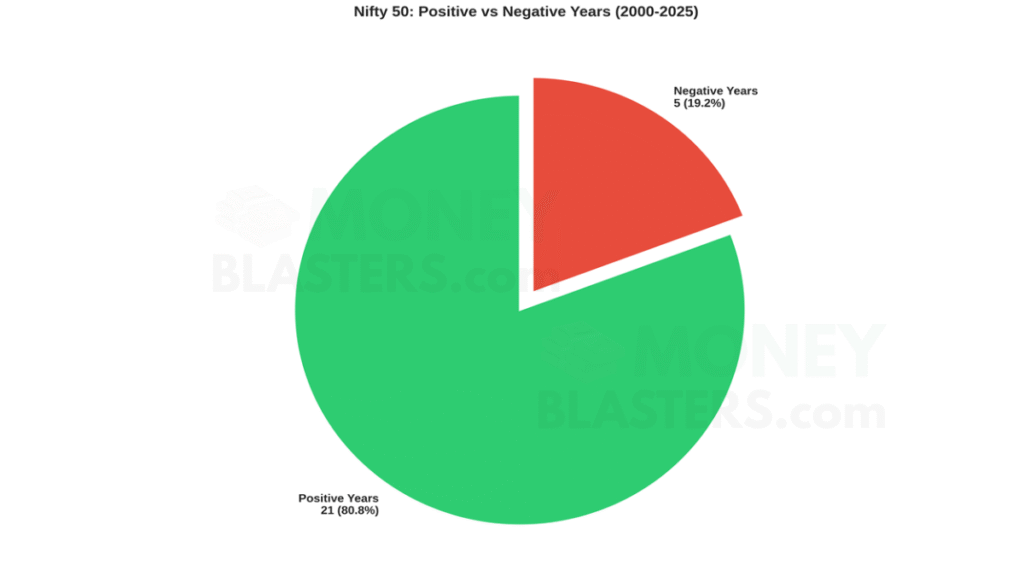
Year-wise Performance Analysis
Out of 26 years analyzed, the Nifty 50 delivered positive returns in 21 years (80.8%) and negative returns in only 5 years. This demonstrates the index’s strong long-term bias towards growth.
| Metric | Value |
| Total Years Analyzed | 26 |
| Positive Return Years | 21 (80.8%) |
| Negative Return Years | 5 (19.2%) |
| Best Year Return | +71.46% (2009) |
| Worst Year Return | -51.84% (2008) |
Compound Annual Growth Rate (CAGR) & Returns
The true power of investing in the Nifty 50 becomes evident when we look at the long-term compounded returns. Despite short-term volatility and multiple corrections, the index has consistently rewarded patient investors.
| Performance Metric | Value |
| Investment Period | Jan 3, 2000 – Feb 9, 2026 |
| Starting Nifty Level | ₹1592.20 |
| Ending Nifty Level | ₹25867.30 |
| Compound Annual Growth Rate (CAGR) | 11.27% |
| Absolute Return | 1524.63% |
| ₹1 Lakh Investment Growth | ₹1624626 |
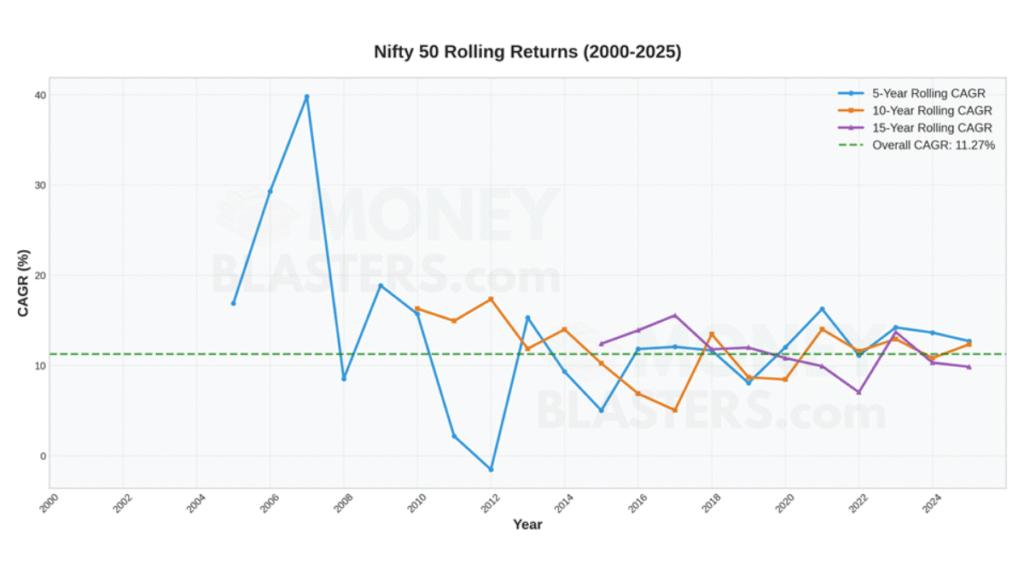
Rolling Returns Analysis
Rolling returns help investors understand how the Nifty 50 has performed over different investment horizons. This analysis shows that longer holding periods generally result in more consistent positive returns, reducing the impact of short-term volatility.
Key Investment Insights
- Long-term Wealth Creation: The Nifty 50 has proven to be an excellent vehicle for long-term wealth creation, turning ₹1 lakh into over ₹16 lakhs in 26 years.
- Resilience Through Crises: Despite facing multiple severe corrections including the 2008 financial crisis (-51.84%) and COVID-19 crash (-38.5%), the index has always recovered to reach new highs.
- High Probability of Positive Returns: With 81% of years showing positive returns, the odds favor patient investors who stay invested through market cycles.
- Power of Compounding: The 11.27% CAGR demonstrates how consistent returns compound over time to generate substantial wealth.
- Importance of Staying Invested: The rolling returns analysis shows that longer holding periods smooth out volatility and improve the probability of positive outcomes.
Download Historical Data by Year 2000-2026 (09/02/26)
- CAGR (2000-2026) = 11.27% cagr
- Total Return = 1524%
- 26 Years of DATA
- Trading Days = 6493
All historical data is provided in CSV (Comma Separated Values) format, which can be easily opened in Excel, Google Sheets, or any data analysis software. Each file contains columns for Date, Open, High, Low, and Close prices.
Frequently Asked Questions (FAQ)
What is CAGR and why is it important?
CAGR (Compound Annual Growth Rate) represents the mean annual growth rate of an investment over a specified time period. It’s important because it smooths out volatility and shows the true rate of return, accounting for the compounding effect. A CAGR of 11.27% means that on average, the investment grew by this percentage each year.
How difficult is it to find Nifty historical data on Google?
Finding comprehensive, year-wise Nifty historical data can be quite challenging on Google. Data is often scattered across multiple sources, may have inconsistent formats, or require paid subscriptions. Our free downloadable datasets make it easy to access clean, organized historical data for research and analysis.
Should I invest in Nifty index funds based on this historical performance?
While historical data shows strong long-term performance, investment decisions should be based on your individual financial goals, risk tolerance, and time horizon. Index funds tracking the Nifty 50 can be a good core holding for long-term investors, but it’s advisable to consult with a financial advisor for personalized guidance.
What caused the -51.84% decline in 2008?
The 2008 decline was caused by the Global Financial Crisis, which originated in the US subprime mortgage market and spread worldwide. The crisis led to a severe credit crunch, bank failures, and a global economic recession. However, markets recovered strongly in subsequent years, highlighting the importance of staying invested through downturns.
What format is the downloadable data in?
All historical data is provided in CSV (Comma Separated Values) format, which can be easily opened in Excel, Google Sheets, or any data analysis software. Each file contains columns for Date, Open, High, Low, and Close prices.
How often should I review my Nifty investments?
For long-term investors, quarterly or annual reviews are typically sufficient. Frequent monitoring can lead to emotional decision-making during market volatility. The historical data shows that staying invested through market cycles has been the most successful strategy.
The 25-year journey of the Nifty 50 demonstrates the power of patient, long-term investing in quality assets. While short-term volatility is inevitable, the index has consistently rewarded investors who maintained discipline and stayed the course.
Disclaimer
This analysis is for informational and educational purposes only. Past performance does not guarantee future results. The data presented here is based on historical Nifty 50 index values and should not be construed as investment advice. Investors should conduct their own research and consult with financial advisors before making investment decisions. Market conditions, economic factors, and regulatory changes can significantly impact future returns. Investing in equity markets carries risk, including the potential loss of principal.